
Global Canopy Height Models: Extending Earth Engine Apps and Exploring Accessibility
How building flexible Earth Engine workflows and interactive tools helps turn raw data access into real-world usability and accessibility

Wouldn’t you know it the first post this year is about building with Earth Engine apps outside Earth Engine and why this was a fun experiments with the backends, what can you build with Earth Engine calls outside the Code Editor window or Earth Engine Apps. Not only that we also built a more visual way to explore the Amazon AWS Open Data Registry for the same dataset.
The idea took shape while exploring an Earth Engine application developed in collaboration with AI for Meta and the World Resources Institute. The experience was smooth, the data was rich, and the interface did exactly what it was designed to do. But the Earth Engine App interface meant it constrained how the data could be explored, how interactions should happen, and ultimately, what workflows were possible.
It left behind a more open-ended question: what would a different interface look like if it we could still use Earth Engine as our backend but focused on user needs (mainly me for now)? What followed wasn’t a replacement for existing tools, but a prototype. A small, evolving set of tools that explores what becomes possible when you rethink the space between powerful infrastructure and everyday usability and to learn a few concepts and have fun. Both tools are designed to explore accessibility either from the Earth Engine app as well as the S3 bucket and exploring outcomes.
Getting Started but wait “The Canopy Height Data Downloader”
Before we take a deeper dive on Web tokens and what the Earth Engine Application does, I will introduce the Global Canopy Height Data Explorer which allows you to fetch the data download links from S3 buckets which houses this over 22 Terabytes of data. Why because we like being visual, you can
Select countries from a list
Select tiles or upload your geometry to get the download link
I have precomputed the years and date information from about 1.5TB of metadata so you know frequency of dates per tiles as well as dominant date by area contribution to a tile
Finally you can select the tiles to visualize them , get the download links and download them all. If that’s what you are looking for go to this application https://chm.geocarpentry.org
With that out of the way and to make this thing work all you need is Earth Engine App tokens. Now if you just want to download the data I would recommend using the tool I mentioned above.
Unpacking the Tokens
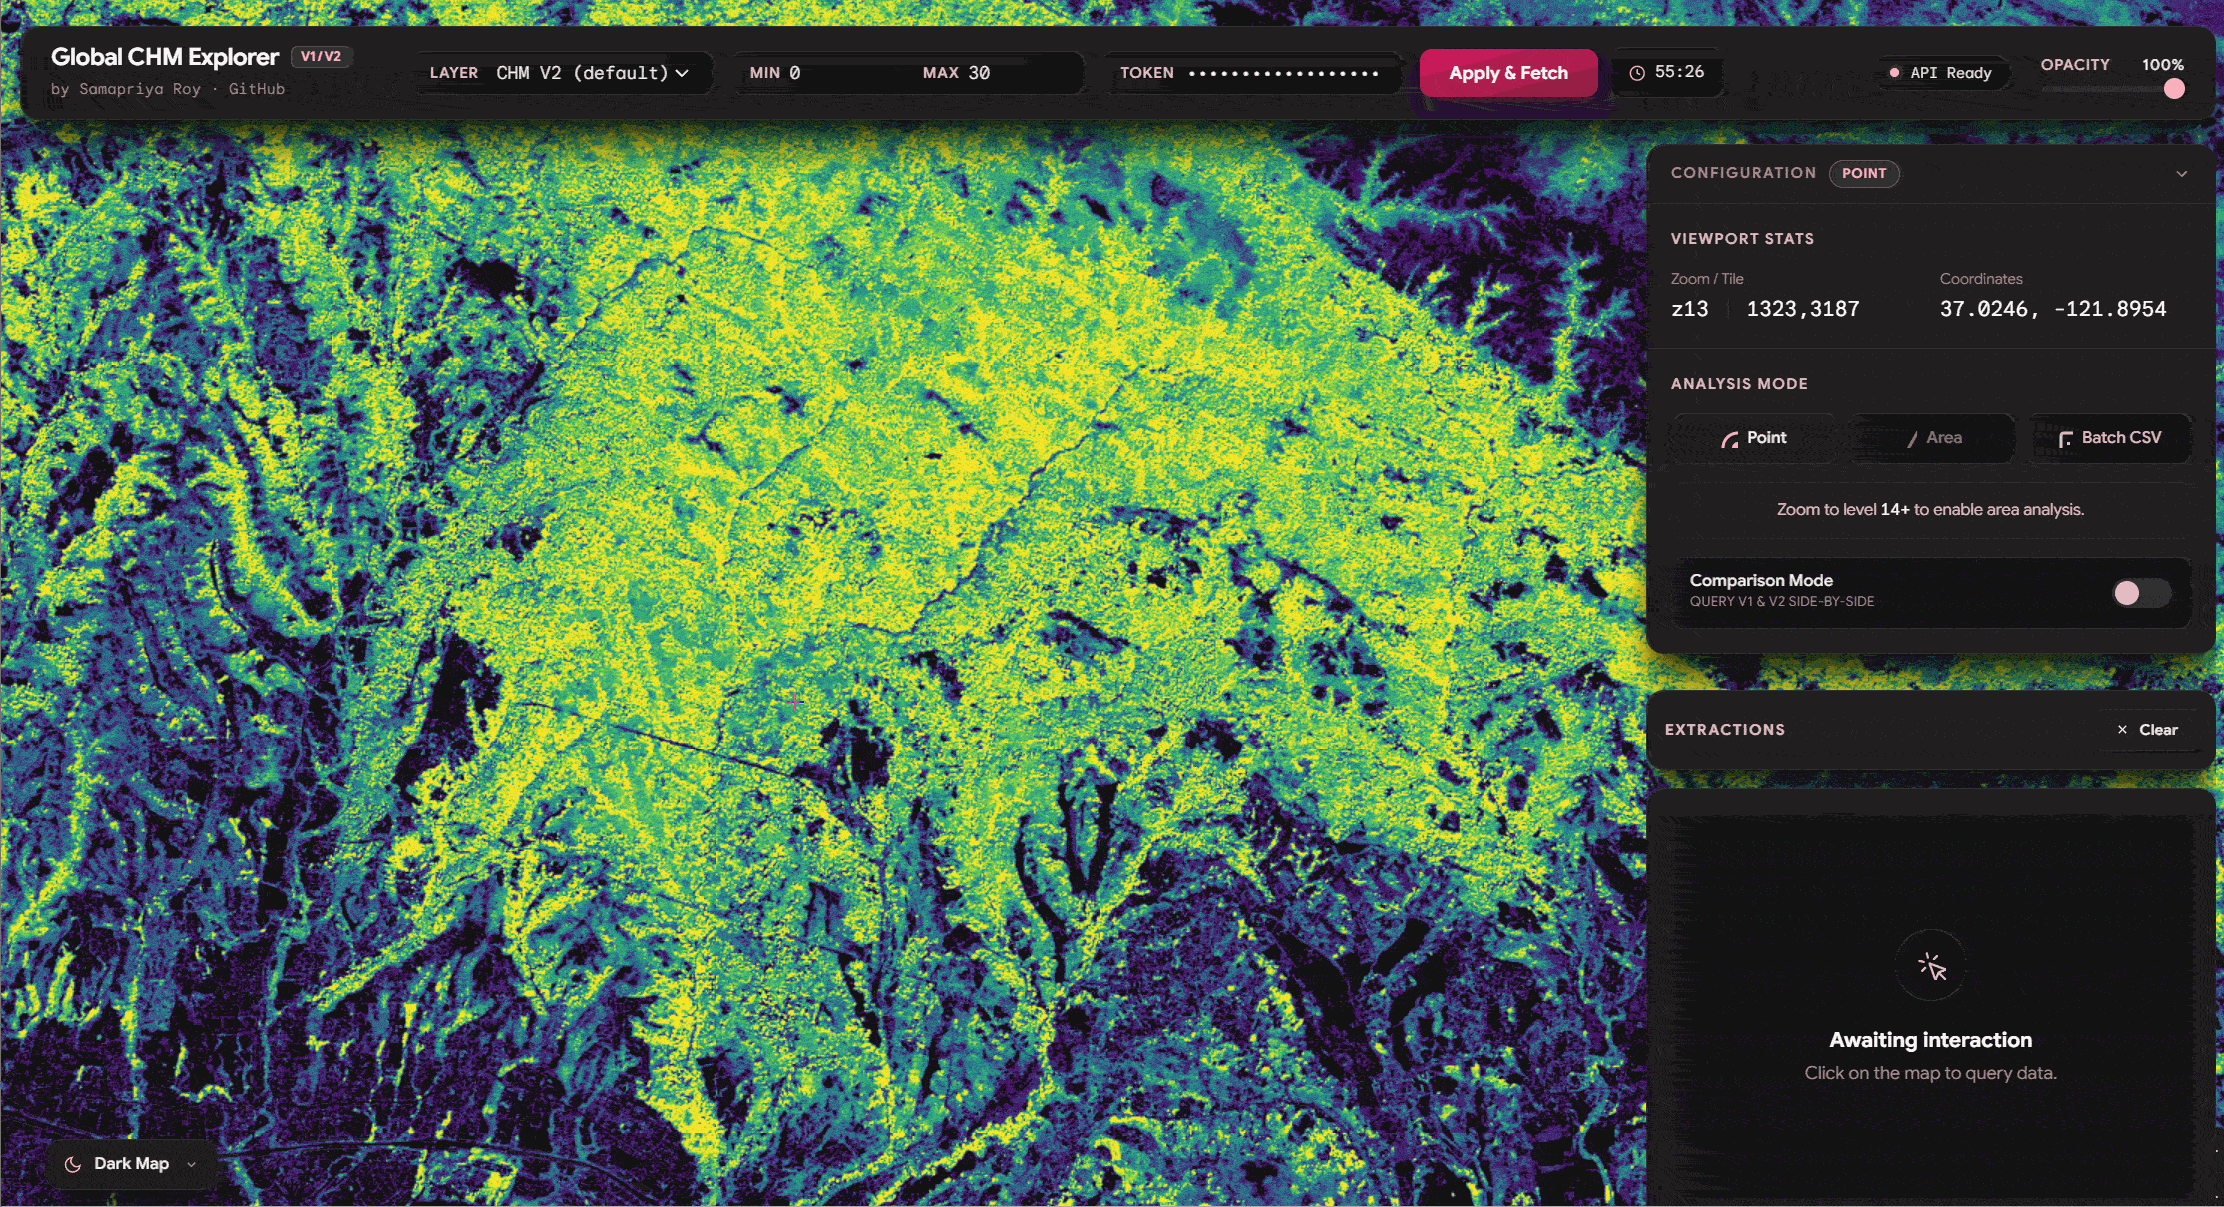
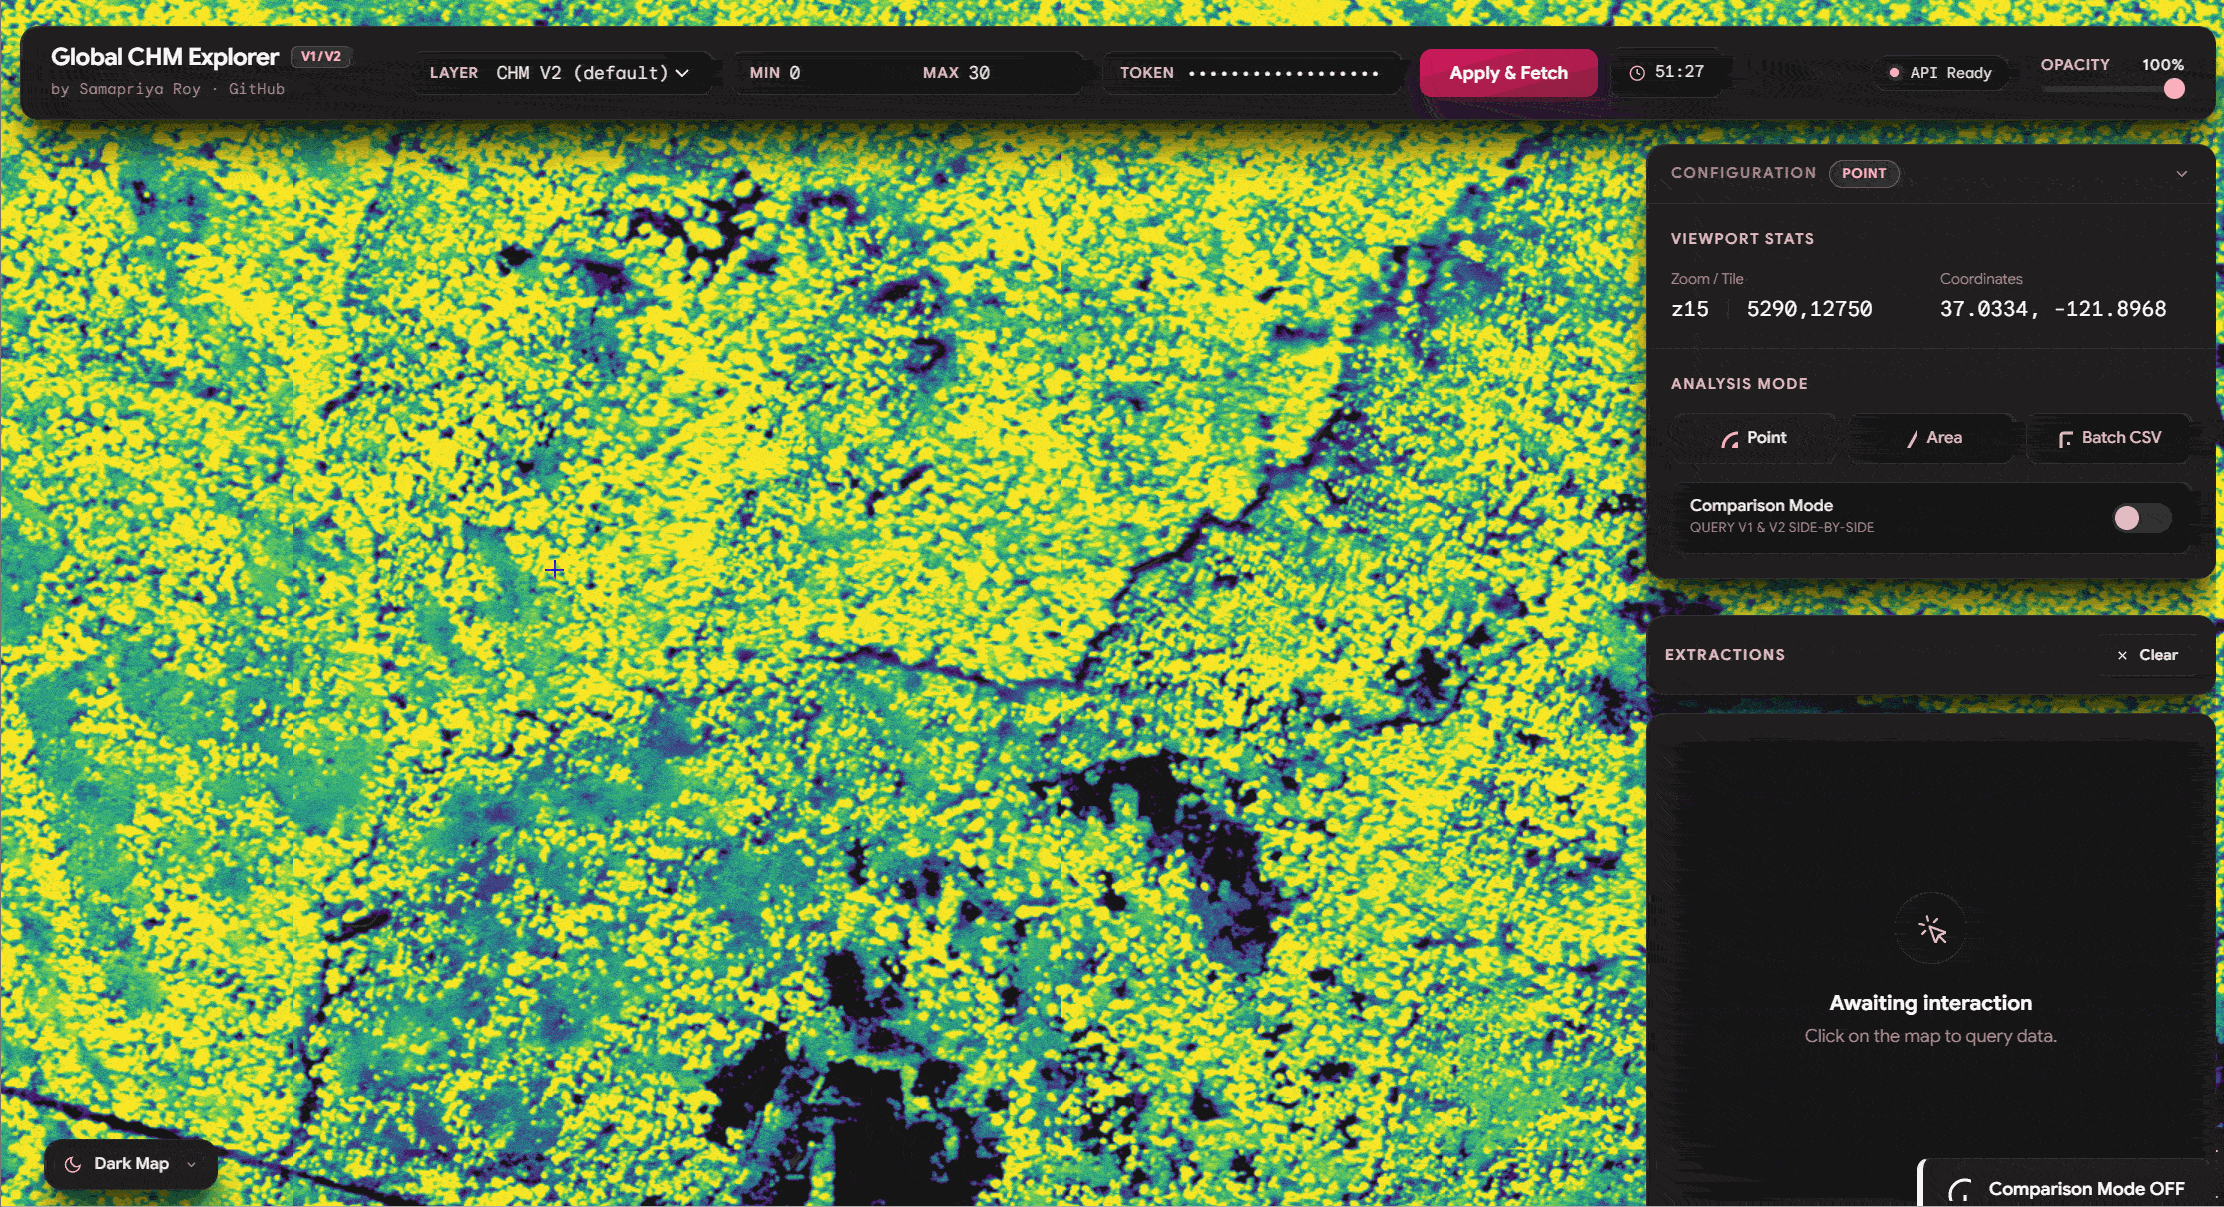
Tokens are like short lived access pass you get an hour to do something and then they expire and you mint another one unless you can continuously refresh. Here we are going low key. Earth Engine tokens are short-lived; they expire in exactly 60 minutes. To make this UX friendly, I built a live countdown timer into the app’s navigation bar. It shifts from pink to yellow, and finally to red as your token nears expiration. It’s a temporary pass, but it provides exactly what we need to perform on-the-fly planetary analysis directly in the browser.
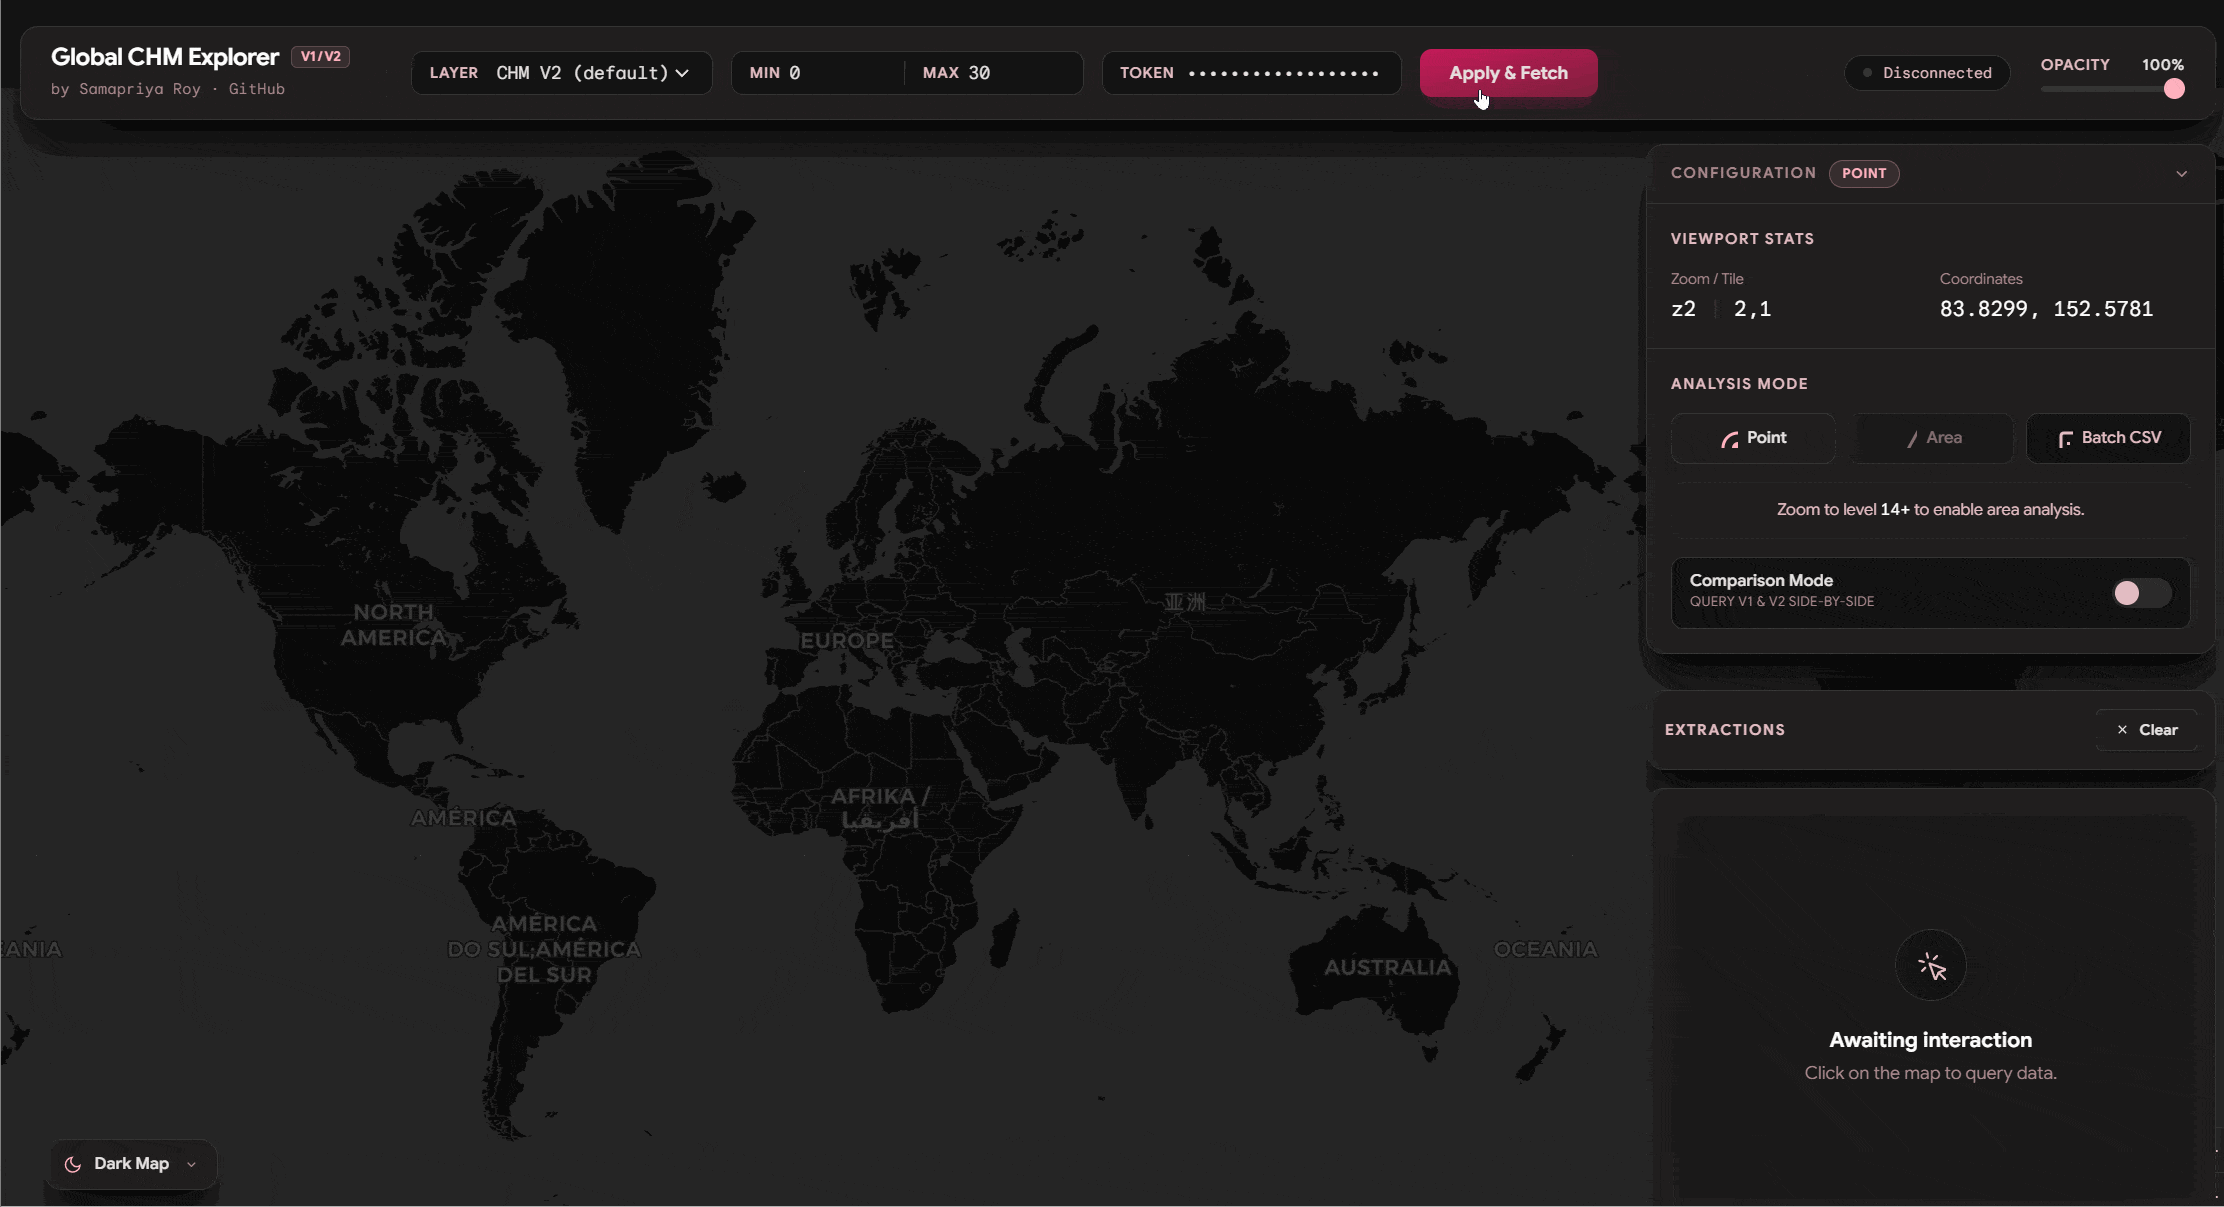
Point Data and Compare Features
One of the things we see we can do is similar to the original app you can click on any point and get the values of the tree canopy height. It is also important to mention that since we have both v1 and v2 of these datasets you can literally toggle the compare feature and watch this fetch the data. Also you can export the data including source, lat long and other information onto a CSV or a JSON
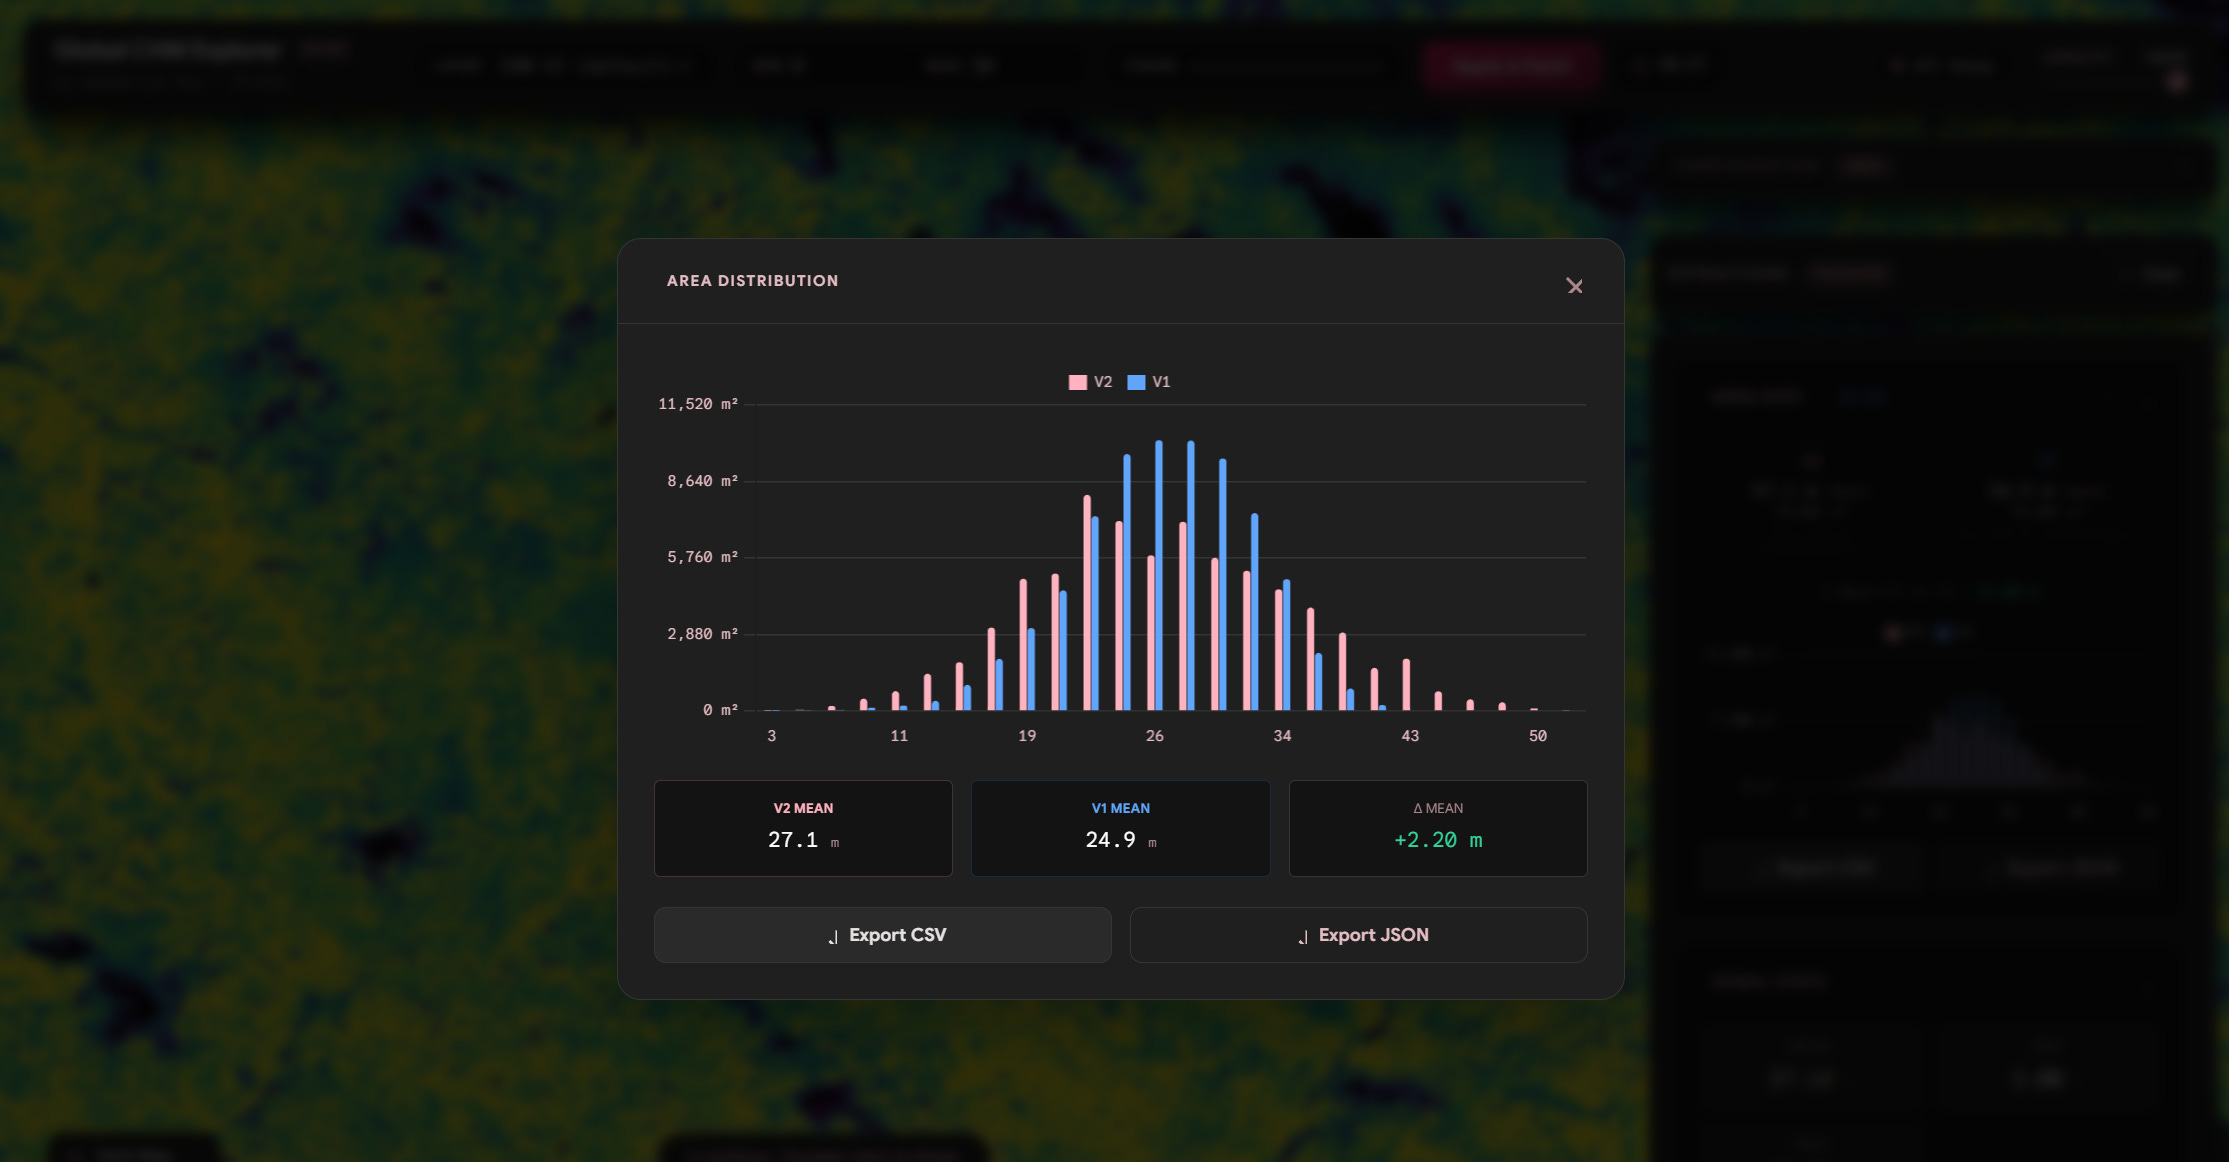
Area Compare (Extending Zonal Stats)
We can already see why this can be fun but we can go further and use the same logic of comparing area and even extend it to get zonal statistics and do this for hundreds of lat long positions simply to export the CSV quick and fast
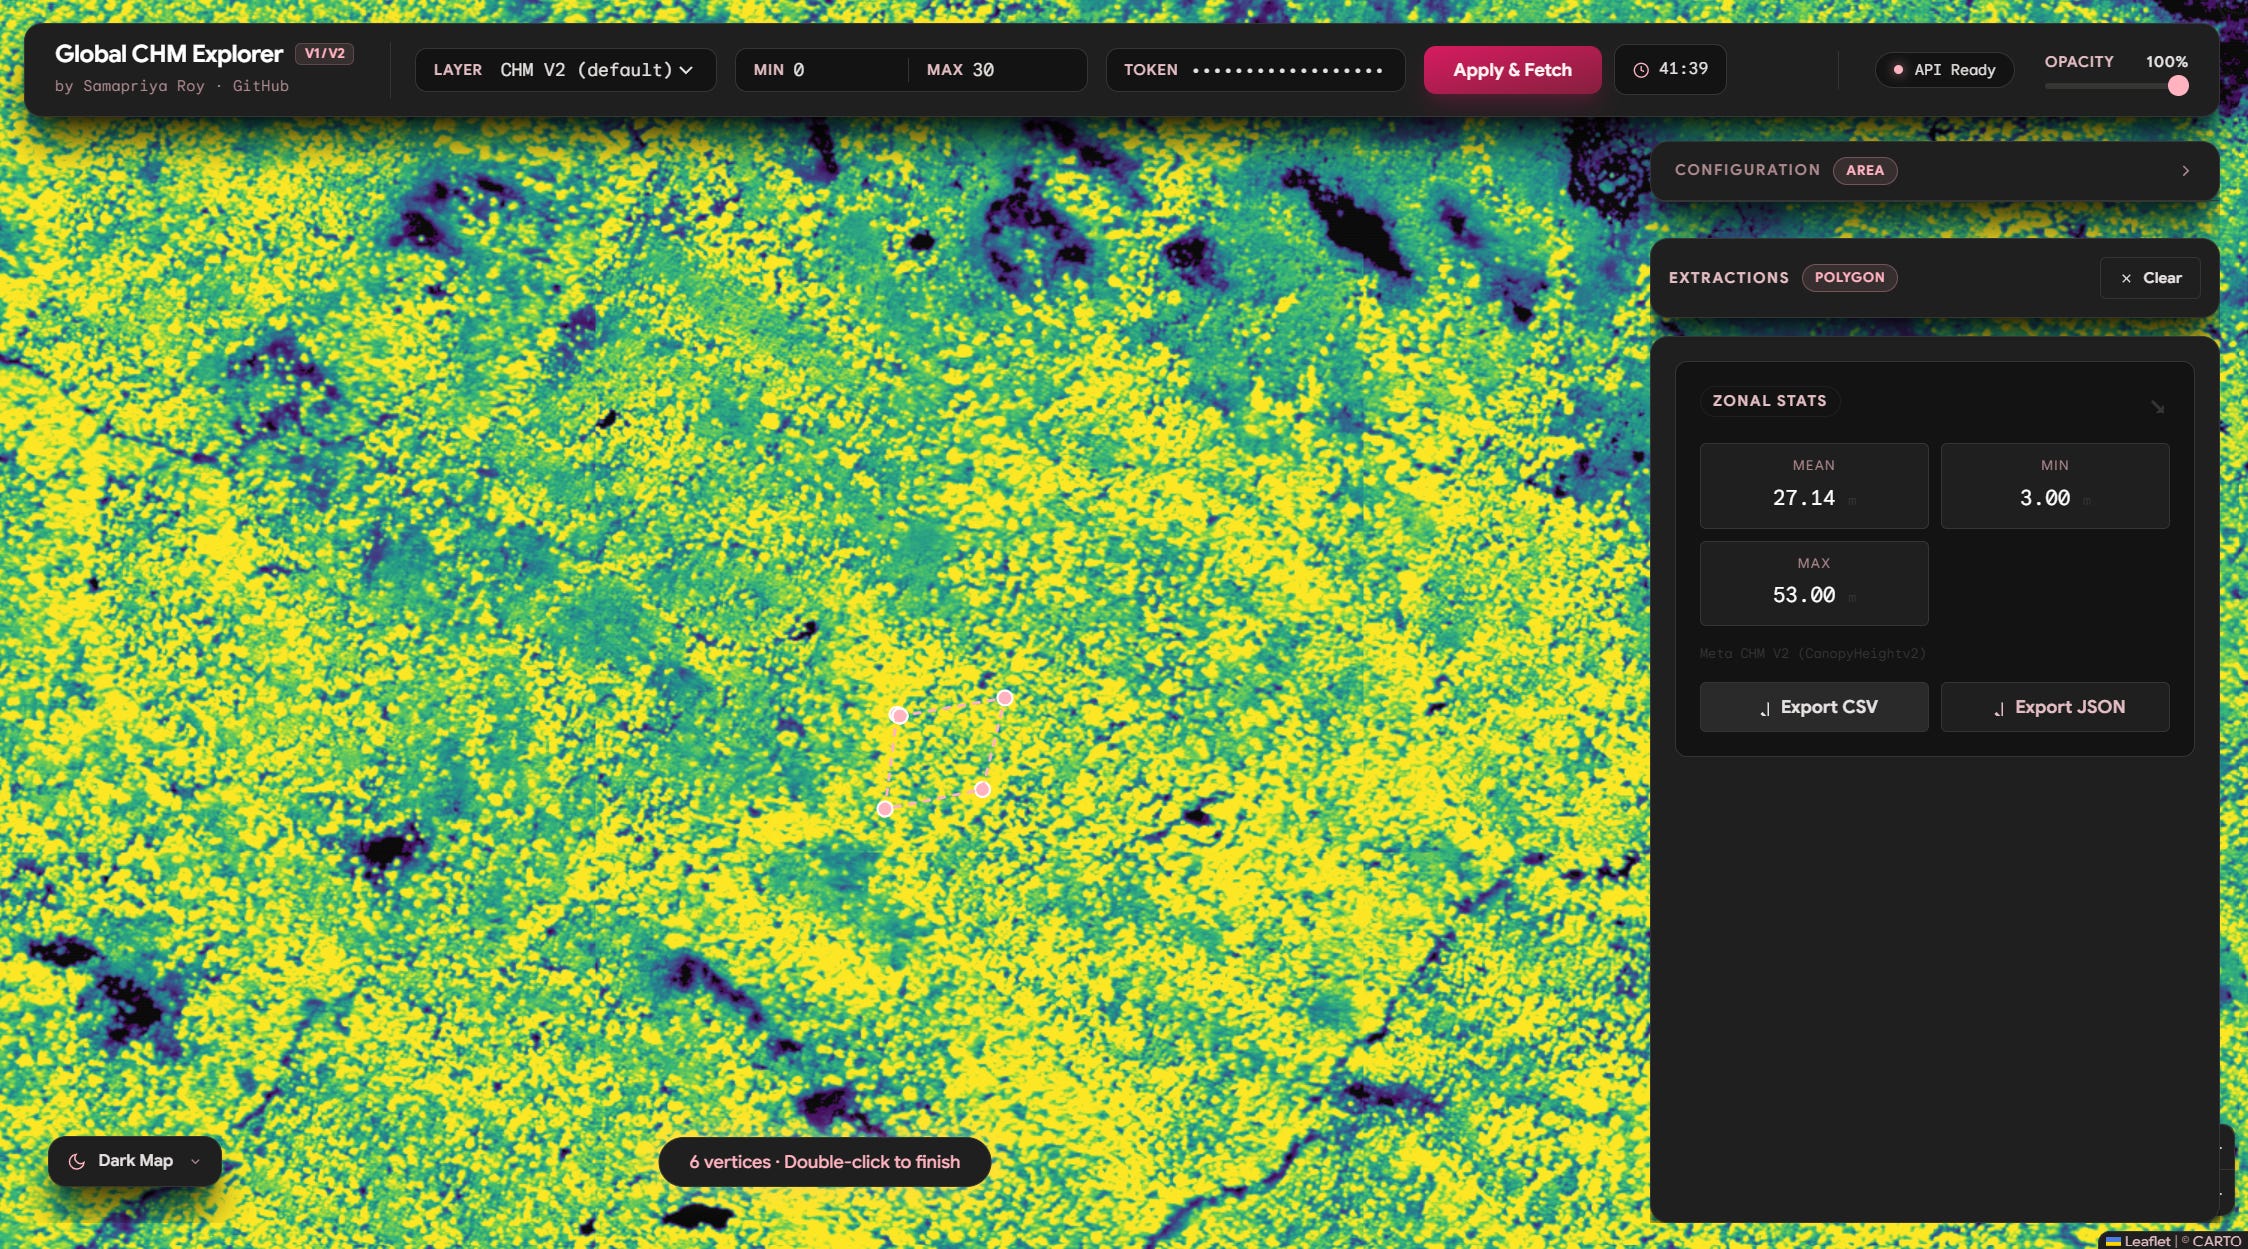
and lets compare distribution with v1 vs v2
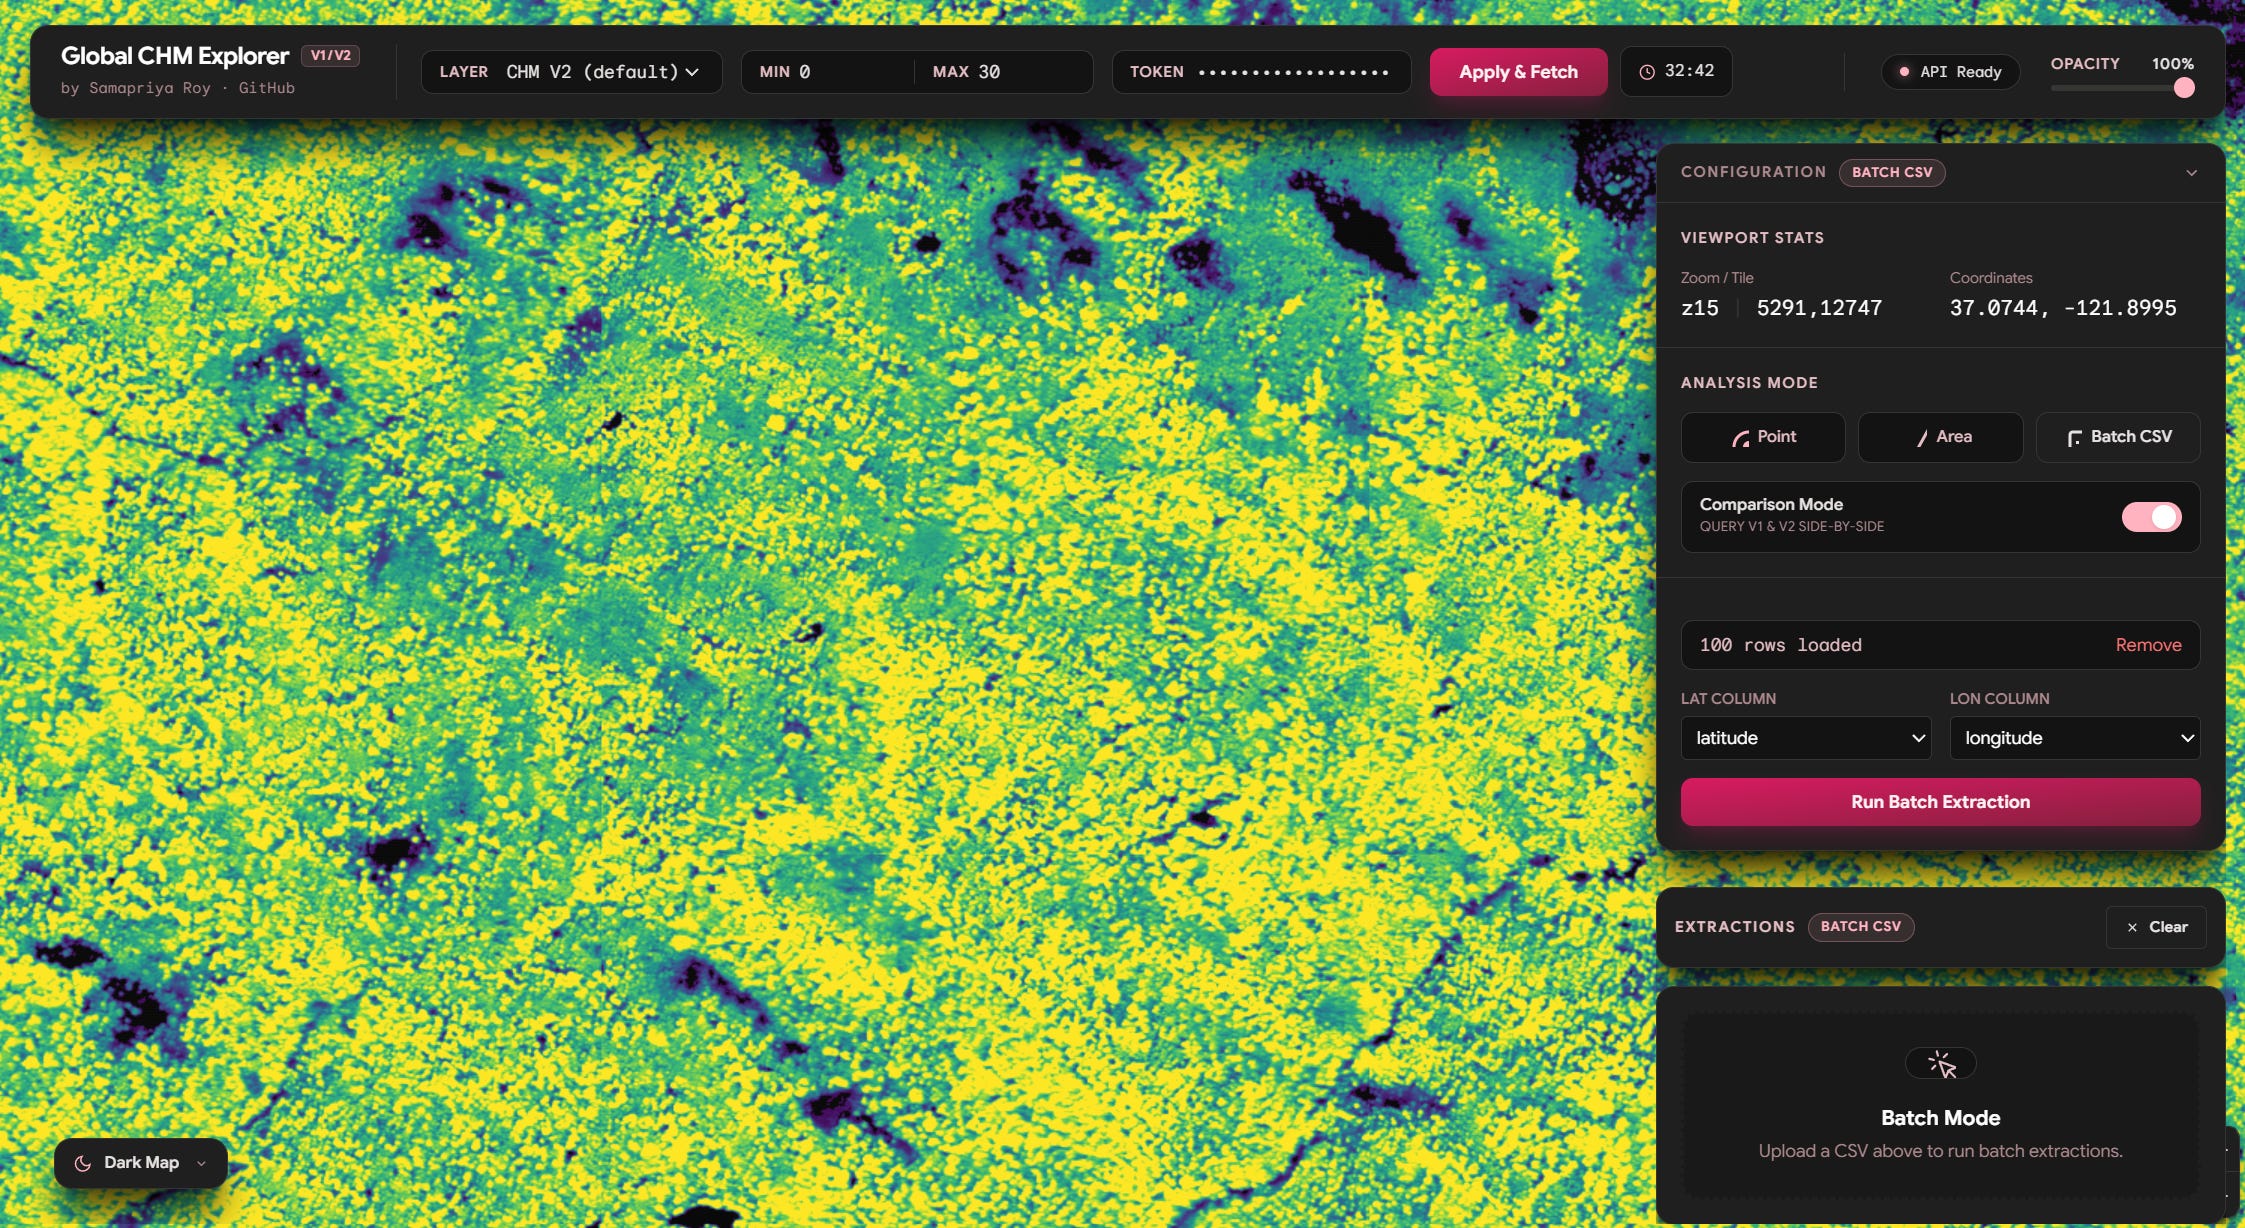
The Batch mode is self explanatory, you can use this to upload a CSV with latitude and longitude of points you want to sample these are then sent to Earth Engine and you get Canopy height for those locations
Building Accessibility beyond Access
We are often confused that building access might equate to the last mile of building accessibility. Both of my experiments and tools were set around the accessibility divide from data access. Because accessibility isn’t just about whether data exists. It’s about whether people can reach it, understand it, and actually use it in the context of their work. By stepping outside the standard Code Editor environment, and listening to what might be needed on a lower and yet the most relevant user level matters most.
While this was designed as a prototype built to learn and serve a specific community need as the dataset will probably end up being a public collection soon. It nudges on the door of the what is possible and whether platforms, datasets, networks or ideas remain our constraints. The result is a reminder that even lightweight, imperfect prototypes can meaningfully shift how people interact with data.
As more datasets become open and more platforms mature, the real challenge isn’t just expanding access it’s closing the gap between availability and usability. Because in the end, data is only as powerful as the number of people who can actually use it. The gee-community-catalog.org will have a major release soon with more data data updates and improvements so stay tuned.
Ok, I have just started receiving these emails.
My interest is in monitoring apparent land surface temps over quite a small area (south island, New Zealand) as well as any other surface data I can gather that will serve seismic research purposes. Am I in the right shop? What features might I have access to and what is the most recent data I vould access?
Thanks