What's Cooking in Google Earth Engine Community Catalog Release 2.9.0
This month with release 2.9.0 of the Awesome GEE Community Catalog, dive into ten new datasets and crucial updates to existing ones. Featuring over 491 TB of data and 4.12 billion individual features!
It's been a productive and bustling month behind the scenes since our last release of the Awesome GEE Community Catalog. We've been hard at work 💪, with exciting new additions and several important updates that reflect the ever-evolving nature of the catalog 🌟. With the help of our dedicated community 🤝, we've kept pace with changes in the datasets, ensuring that the most current information is available for everyone to use 📊.
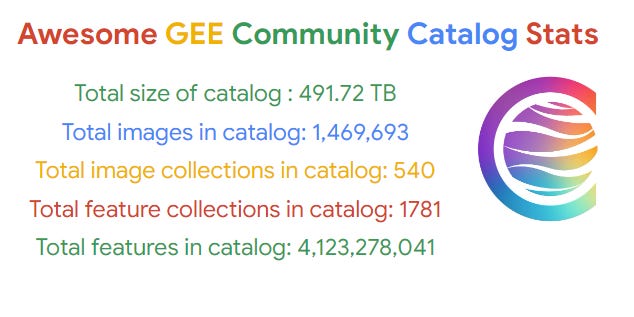
Quick glance: we are staring at about 491 TB of data 💾 with over 2,669 datasets 📚, more than 1,469,693 images 🖼️ spread across 540 image collections 📂. The catalog also features 1,781 feature collections 🗂️, containing a staggering 4.12 billion individual features 🌍 and nearly 500,000 visits last month 👥.
This month's release introduces ten new datasets 📈 and brings updates to six more 🔄, ranging from population mapping to global peatland coverage 🌿. These changes highlight both our thematic focus and our commitment to addressing the requests and feedback from contributors and users of the catalog 🗣️. Below, you’ll find the latest additions and updates for this release, showcasing how we’re expanding and refining the catalog to meet the diverse needs of our community 🚀.
🎧 Want to hear an AI-generated audio summary before you dive in? I’m loving the conversational tone—it’s like producing my own radio show! 😄 Well, maybe I could’ve said it better... but go ahead, give it a listen!
As always to find links to these datasets click on dataset name or find them in the changelog.
POPCORN Scalable Population Mapping with Sentinel-1 & Sentinel-2
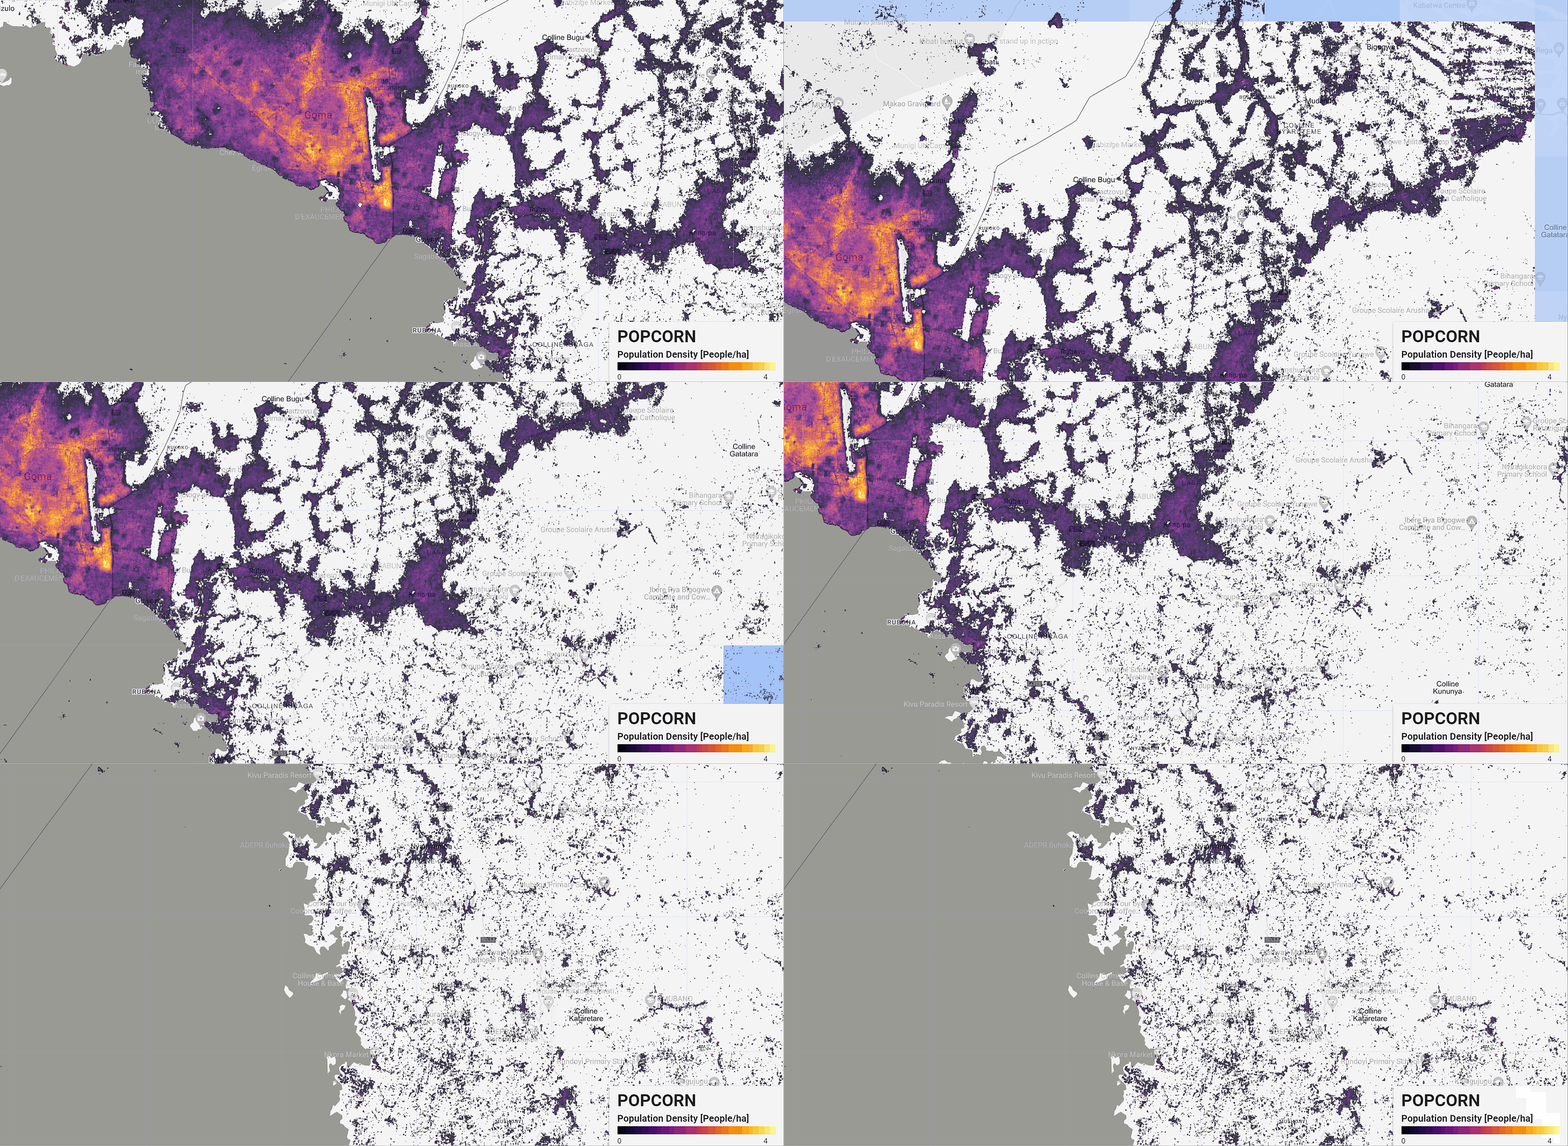
Popcorn (POPulation from COaRrse census Numbers) is a cutting-edge method designed to overcome challenges in creating accurate population maps, particularly in areas with limited data. By leveraging freely available satellite imagery from Sentinel-1 and Sentinel-2, combined with a small number of aggregate census counts, Popcorn delivers more accurate population estimates than traditional methods relying on high-resolution building footprints.
For instance, Popcorn generated 100m resolution population maps for Rwanda using fewer than 400 regional census counts, achieving an accuracy score of 66% in Kigali, with an average error of just 10 inhabitants per hectare. This method also retrieves detailed maps of built-up areas and occupancy rates, making it a valuable tool for urban planners and humanitarian organizations.
Carbon Security Index
This dataset presents an index developed to assess carbon security across the sagebrush steppe in the Great Basin. The Carbon Security Index (CSI) incorporates data from three key sources: fractional plant cover from the Rangeland Analysis Platform, a fire probability model specific to the Great Basin (Smith et al., 2023), and a resistance and resilience dataset for the sagebrush steppe (Chambers et al., 2014, 2017).
Calculated using a simple formula—Preferred Rangeland Cover + Resistance & Resilience – Fire Probability—the index ranges from -2 to +2. This allows you to easily compare carbon security across different areas, providing crucial insights for conservation efforts.
Carbon Offset Project Boundaries
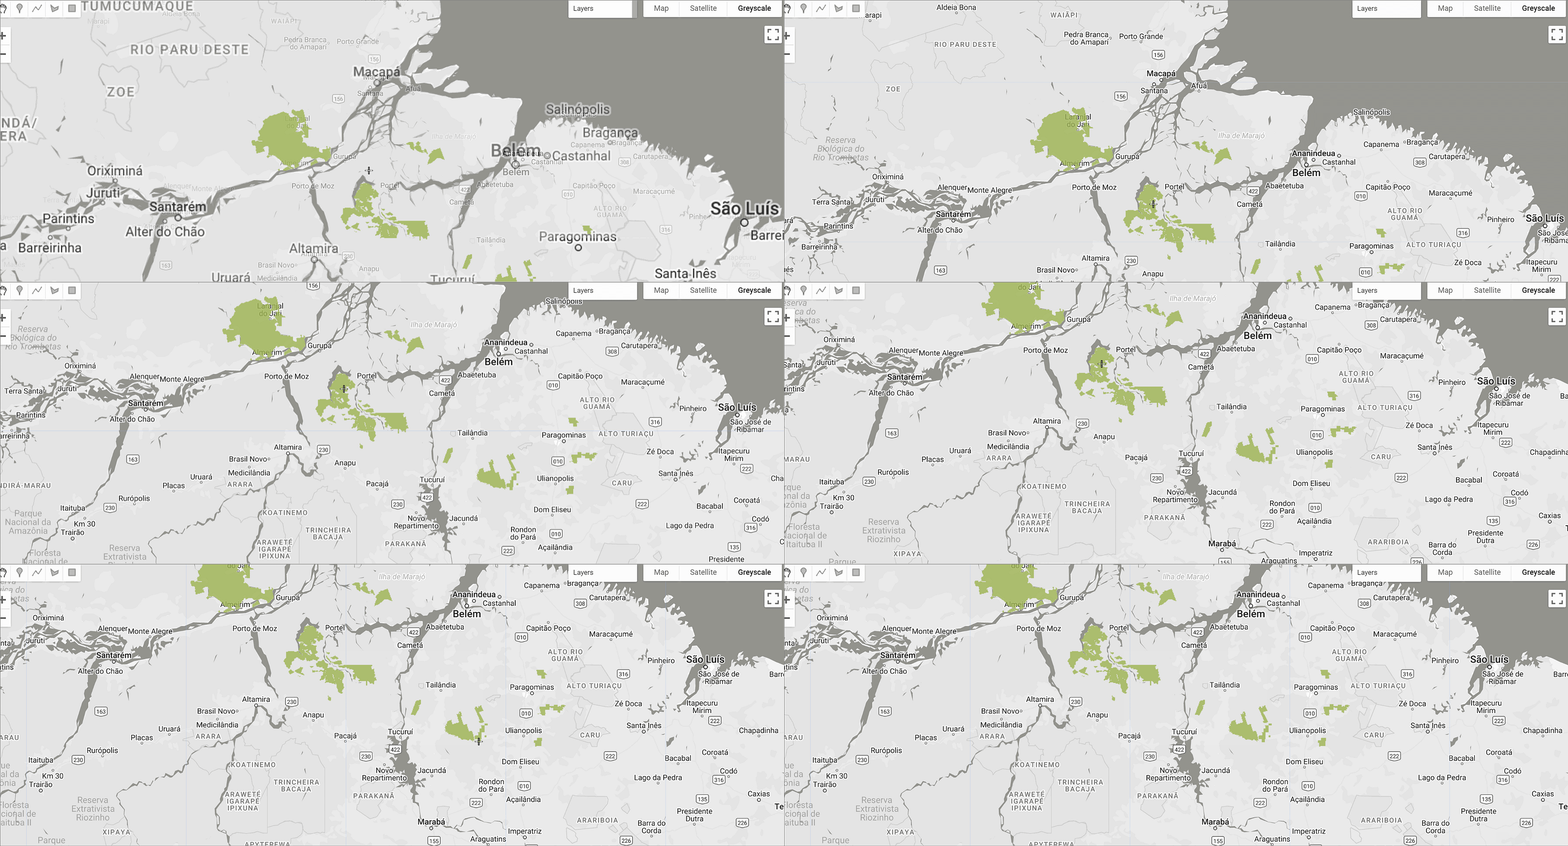
Nature-based climate solutions (NBS) have become a key strategy for reducing atmospheric CO2 and mitigating climate change. Among these, carbon offsets are one of the most widely implemented approaches. However, despite their popularity, carbon offset projects have faced criticism for often exaggerating their impact. Verifying the actual efficacy of these NBS-derived carbon offsets has been a challenge due to the lack of readily available geospatial boundary data.
To address this, a database of nature-based offset project boundaries has been created, offering the locations of 575 NBS projects across 55 countries. The geospatial boundaries were aggregated using data scraped from carbon project registries (n=433, 75.3%) and through manual georeferencing and digitization (n=127, 22.1%). These projects span three types of carbon initiatives: avoided deforestation, afforestation/reforestation/re-vegetation, and improved forest management. An accuracy assessment of the georeferencing and digitizing process showed a high degree of precision with an intersection over union score of 0.98 ± 0.015.
Global Peatland Database and Fractional Coverage Mapping
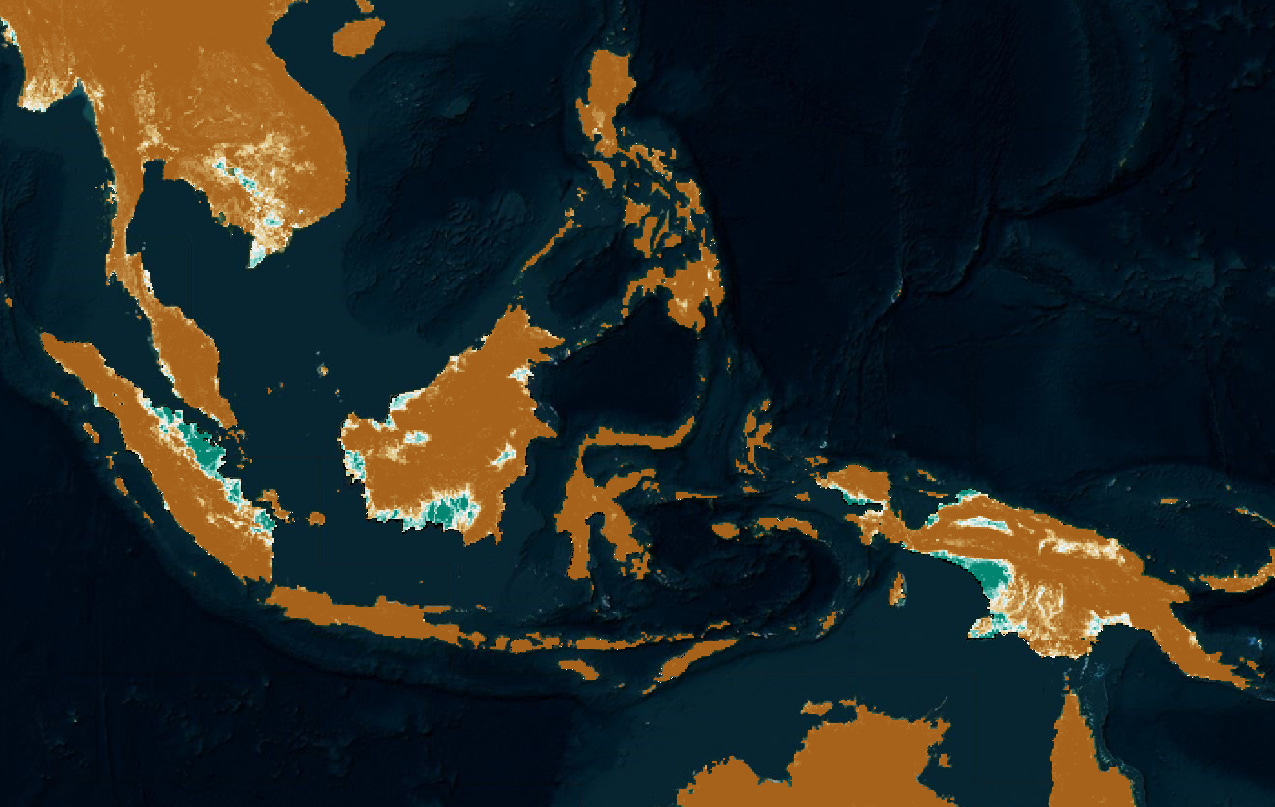
The Global Peatland Map 2.0, introduced by the Global Peatlands Initiative at COP26, offers an enhanced understanding of the location, extent, and drainage status of peatlands and organic soils across 268 countries and regions. This dataset, built from a combination of external data and contributions from the Greifswald Mire Centre, serves as a comprehensive global map that highlights peatland distribution and characteristics. It plays a key role in supporting map production, statistical analysis, and the Global Peatland Assessment 2022.
Complementing this, the Peat-ML dataset provides a spatially continuous global map of peatland fractional coverage, crucial for understanding their role in carbon storage and freshwater retention. Developed using machine learning models trained on climate, soil, geomorphological data, and remotely-sensed vegetation indices, Peat-ML integrates peatland data from 14 regions. With an average r-squared of 0.73 and an error margin of 9.11% (root mean square), this dataset offers reliable insights into global peatland coverage.
Urban Heat Island Intensity (UHII)
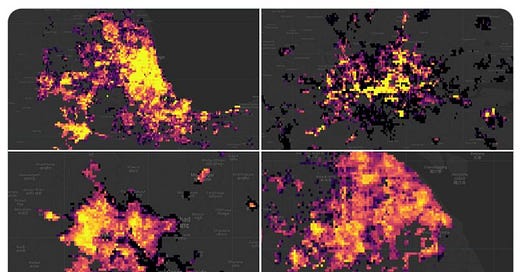
The Urban Heat Island (UHI) effect, a significant result of urbanization, leads to localized warming in cities. Traditional methods for estimating UHI intensity (UHII) often focus on clear-sky surface temperatures, ignoring all-sky and canopy (air temperature) UHII, as well as anthropogenic factors, which can cause uncertainties. To address this, a new dynamic equal-area (DEA) method has been developed, offering more accurate UHII estimates by reducing confounding factors. This global-scale dataset covers over 10,000 cities, providing monthly UHII estimates for more than 20 years and includes surface and canopy UHII under both clear-sky and all-sky conditions.
The data reveals that over 80% of cities experience positive UHII, with annual averages around 1.0°C during the day and 0.8°C at night for surface UHII, while canopy UHII averages 0.5°C. An upward UHII trend is observed in 60% of cities, with a global average increase of over 0.1°C per decade for surface UHII (day) and 0.06°C (night). These trends highlight that cities with stronger UHI effects experience faster UHII growth over time. The dataset, available monthly from 2003 to 2020, offers a valuable resource for urban climate studies.
High Resolution Extended Spring Indices database
The Extended Spring Indices (SI-x) dataset tracks the timing of spring onset and its connection to climate change by using daily minimum and maximum temperatures to model first leaf and first bloom events for key plant species. By converting temperature data into indices, the SI-x also calculates the frost damage index, providing a multi-decadal, high-resolution (1 km) analysis of spring phenology. This dataset covers North America (1980-2022) and Europe (1950-2020), offering valuable insights into how climate change impacts seasonal patterns.
The 1 km SI-x products are available for two regions: North and Central America (14°02'31.3"N to 55°37'04.1"N latitude), generated using Daymet version 4 data from 1980 to 2022, and Europe (35°55'48.7"N to 73°32'47.1"N latitude), developed from the E-OBS version 3 dataset (1950-2020). These datasets include daily maximum and minimum temperatures and modeled daylengths, making them essential tools for studying phenological changes across large regions.
Global Groundwater-Dependent Ecosystems (GDEs)
The Global Groundwater-Dependent Ecosystems (GDEs) dataset provides a high-resolution (30m) map, revealing the extent of GDEs across over one-third of global drylands, including key biodiversity hotspots. These ecosystems, crucial for freshwater and biodiversity, are more extensive in areas with lower groundwater depletion rates, but many have been lost due to unsustainable water and land use practices.
Approximately 53% of GDEs are in regions with declining groundwater levels, yet only 21% are within protected areas, exposing a major conservation gap. This dataset highlights the importance of GDEs in supporting biodiversity and livelihoods, especially in regions like the Greater Sahel, and serves as a vital tool for policymakers to prioritize protection efforts.
Canada 2023 Wildfires
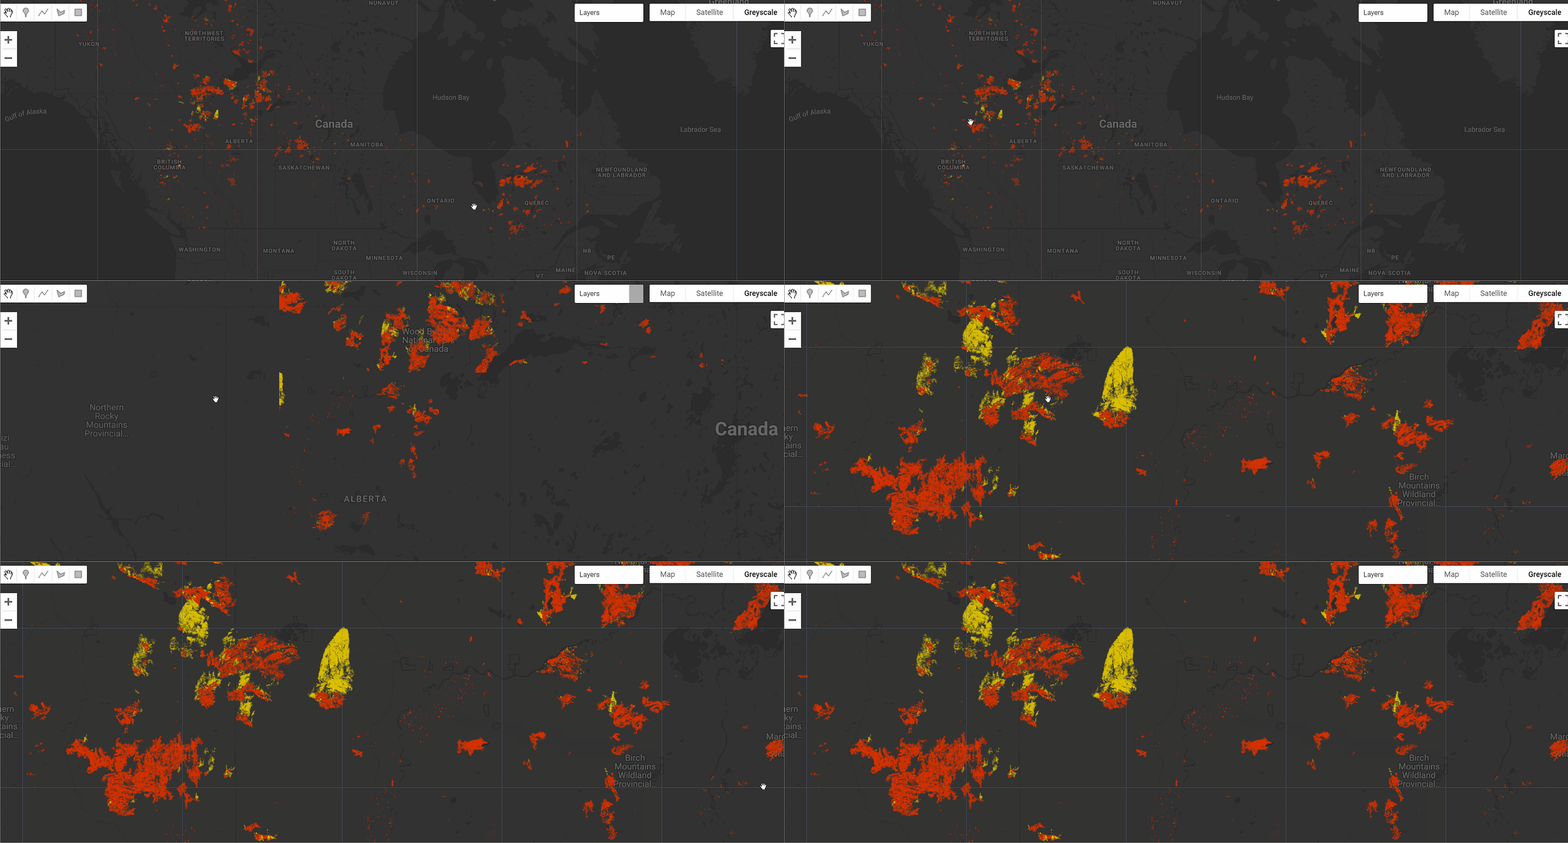
The Canada 2023 Wildfires dataset captures the largest wildfire season in Canada's modern history, with 12.74 million hectares (Mha) burned. Using the Tracking Intra- and Inter-year Change (TIIC) algorithm, wildfires in forested ecosystems were detected at a 30-meter resolution using data from Sentinel-2 and Landsat-8 and -9. Fires are classified into summer (May 30 to September 17) and fall (September 17 to October 25) events, with summer fires accounting for 90.9% of the total burned area.
To reduce errors, fall fires were only detected within a 4-km buffer of official fire perimeters. In total, the TIIC algorithm mapped 1.8% of Canada's forested ecozones as burned, with 11.57 Mha from summer fires and 1.16 Mha from fall fires.
National Structures Inventory (NSI)
The National Structure Inventory (NSI) is a comprehensive database system designed to store and share point-based structure inventories for assessing natural hazards, with a focus on flood risk. It contains detailed information on each structure, allowing for the calculation of damages and life safety risks from various hazards. The 2022 NSI base data was created by the U.S. Army Corps of Engineers (USACE) to streamline GIS pre-processing workflows for hazard modeling and analysis.
The NSI base layer, maintained by USACE, is widely used by agencies like FEMA and supports applications beyond flood risk assessment. Accessible through a structured RESTful API, the inventory provides key attributes for each structure, making it a valuable tool for risk analysis and emergency planning.
Global Mangrove Watch
This study, now incorporating Sentinel-derived v4.0.19 raster and vector extent data, uses L-band SAR datasets from JAXA for 11 epochs (1996–2020) to create a long-term global mangrove time-series. The map-to-image change detection approach updated the baseline map (GMW v4.0.19) using thresholding and a mangrove change mask. Despite some challenges like SAR mis-registration and confusion in fragmented areas, the overall mangrove extent maps achieved 87.4% accuracy, though change class accuracies were lower (58.1% for gain, 60.6% for loss).
Global Mangrove Watch Version 4.0.19 provides the most detailed record to date and supports monitoring, conservation, and risk assessments for mangrove ecosystems globally.
Canadian Satellite-Based Forest Inventory (SBFI)
The Satellite-Based Forest Inventory (SBFI) provides updated data on Canada's forest land cover, structure, species, and stand age in 2020, along with disturbances from 1985-2020. The dataset was revised to correct erroneous values related to forest structure (e.g., Canopy Height, Canopy Cover, Lorey's Height, Basal Area, Biomass, and Volume) in certain polygons. Additionally, all polygons have now been merged for improved consistency.
More than 25 million polygons, representing homogeneous forest conditions, were delineated using a multiresolution segmentation algorithm applied to 2020 Landsat imagery, fire year, and harvest year layers. A minimum map unit of 0.45 ha (5 pixels) was used to define polygons, covering Canada’s ~650 Mha forested ecosystems. This common inventory system provides spatially explicit, consistent information across all jurisdictions, managed and unmanaged forests, utilizing free and open satellite data.
Let’s stay connected! Feel free to reach out on Linkedin and Github to share your ideas, offer feedback, or dive into the discussion.
If you’re enjoying the project, consider giving the GitHub repository a star⭐️—it’s a small but impactful way to support the growth and visibility of our community catalog.
Don't forget to check the changelog for the latest updates and direct links.💡 You can also support this effort by becoming a sponsor and helping us grow an even more vibrant community🌍
💡 Exciting updates are on the horizon, so stay tuned as we continue to enhance this valuable resource!

